Creating Comparison Content sets the stage for dynamic storytelling, blending insightful comparisons with a touch of creativity that captivates readers from the get-go. Dive into the world of crafting compelling content that informs and entertains.
Introduction to Creating Comparison Content
Comparison content is a type of content that presents a detailed analysis of different products, services, or options to help consumers make informed decisions. It typically highlights the key features, benefits, and drawbacks of each option, allowing consumers to compare and contrast them side by side.
Creating comparison content is crucial for consumers as it simplifies the decision-making process by providing them with all the necessary information in one place. It helps consumers save time and effort by eliminating the need to research multiple sources and compare options themselves.
Examples of Successful Comparison Content
- Technology: Websites like CNET and TechRadar provide comparison content for smartphones, laptops, and other gadgets, detailing specifications, prices, and reviews to help consumers choose the best option for their needs.
- Travel: Platforms like TripAdvisor and Booking.com offer comparison content for hotels, flights, and vacation packages, allowing travelers to compare prices, ratings, and amenities before booking.
- Finance: Websites like NerdWallet and Bankrate provide comparison content for credit cards, loans, and savings accounts, enabling consumers to compare interest rates, fees, and rewards to find the most suitable financial products.
Types of Comparison Content
When creating comparison content, there are various formats that can be used to effectively present information. Some common types include tables, infographics, and charts. Each format has its unique advantages and is suitable for different purposes.
Tables
Tables are a straightforward way to compare data side by side. They are useful for organizing large amounts of information in a structured manner. For example, a table can be used to compare the features of different products or services, making it easy for readers to see the differences at a glance.
Infographics
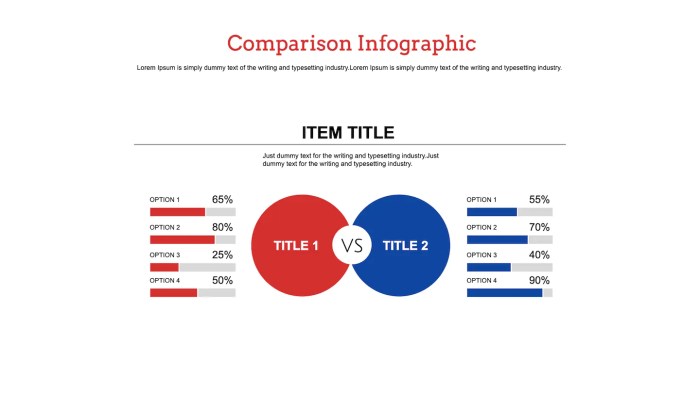
Infographics are visually appealing representations of data that combine images, charts, and text to convey information in a more engaging way. They are great for presenting complex information in a simple and easy-to-understand format. For instance, an infographic can be used to compare the benefits of two competing solutions in a visually compelling manner.
Charts
Charts are graphical representations of data that can help readers quickly grasp trends and comparisons. They are ideal for showing relationships between different variables or highlighting key differences. For example, a bar chart can be used to compare sales figures for multiple products over a period of time, allowing for a clear visualization of performance.
Choosing the right type of comparison content depends on the specific goals of the content and the target audience. Tables are best suited for presenting detailed data, while infographics are great for capturing attention and simplifying complex information. Charts are effective for visualizing trends and patterns. By understanding the strengths of each format, content creators can select the most appropriate type of comparison content to effectively communicate their message.
Identifying Key Elements for Comparison
When creating comparison content, it is crucial to identify the key elements that will make your comparison informative and effective. These elements will help your audience make informed decisions based on the information presented. Let’s dive into the essential elements to include in comparison content.
Criteria Selection
When selecting criteria for comparison, it is important to consider the relevance and significance of each factor. The criteria should directly impact the decision-making process and provide valuable insights to the audience. Make sure to choose criteria that are measurable, objective, and specific to the subject matter being compared.
Accuracy and Fairness, Creating Comparison Content
To ensure accuracy and fairness in comparison content, it is essential to gather reliable data from credible sources. Double-check the information to avoid any inaccuracies or biases that could mislead your audience. Present the data objectively, without skewing the results to favor one side over the other. Transparency and honesty are key to maintaining credibility in your comparison content.
Crafting Compelling Comparison Content

When it comes to writing engaging and informative comparison content, there are a few key tips to keep in mind. First, make sure to clearly Artikel the items or subjects being compared so that readers can easily follow along. Secondly, provide detailed information on each item to help readers make informed decisions. Lastly, use a mix of data, examples, and real-life scenarios to make the content relatable and interesting.
Structuring the Content
To structure your comparison content for easy comprehension, consider using bullet points or tables to highlight key differences or similarities between the items being compared. Start with a brief introduction to set the context, then present the information in a logical order that flows smoothly from one point to the next. Make sure to use clear headings and subheadings to break up the content and guide readers through the comparison.
- Use bullet points or tables to highlight key differences or similarities.
- Start with a brief introduction to set the context.
- Present information in a logical order that flows smoothly.
- Use clear headings and subheadings to guide readers through the comparison.
Making Comparison Content Visually Appealing
To make your comparison content visually appealing, consider using charts, graphs, or infographics to present data in a more engaging way. You can also use color-coding or icons to help distinguish between different items or categories. Additionally, include images or illustrations to break up the text and make the content more visually interesting.
| Comparison Category | Item A | Item B |
|---|---|---|
| Price | $50 | $70 |
| Features | Basic | Advanced |
Tools and Resources for Creating Comparison Content

When it comes to creating comparison content, having the right tools and resources at your disposal can make a huge difference in the quality and accuracy of your work. From software to online platforms, there are various options available to help you streamline the process and present information in a clear and engaging way.
Software for Creating Comparison Content
- Microsoft Excel: A versatile tool for organizing and analyzing data, Excel can be used to create tables, charts, and graphs for comparison purposes.
- Google Sheets: Similar to Excel, Google Sheets offers online collaboration features that allow multiple users to work on comparison content simultaneously.
- Canva: A graphic design platform that provides templates and tools for creating visually appealing comparison infographics.
Online Tools for Creating Comparison Content
- Diffen: A website that allows users to compare products, services, or concepts side by side with detailed analysis.
- Tableau Public: A data visualization tool that enables users to create interactive charts and dashboards for comparison purposes.
- Statista: A database of statistics and studies from over 22,500 sources, providing reliable data for comparison content.
Importance of Data Sources and Verification
When creating comparison content, it’s crucial to use reliable and accurate data sources to ensure the credibility of your work. Always verify the information you use by cross-referencing multiple sources and checking for any biases or inaccuracies. This will help you present a well-rounded and unbiased comparison to your audience.
Tips for Finding Reliable Data for Comparison
- Government Websites: Official government sources often provide trustworthy data on a wide range of topics for comparison purposes.
- Academic Journals: Peer-reviewed studies and research articles can offer valuable data and insights for creating in-depth comparisons.
- Industry Reports: Reports from reputable organizations and companies within a specific industry can provide up-to-date and relevant data for comparison content.

