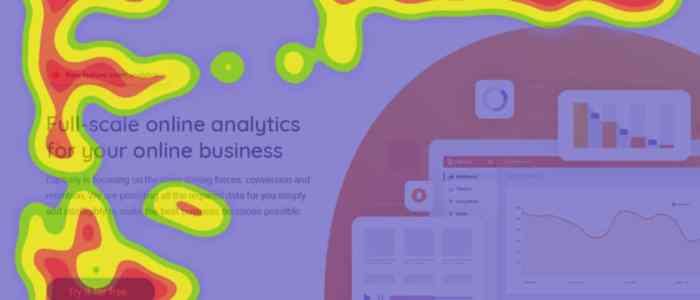
Using Heatmaps for UX is like unlocking a secret code to understanding user behavior and interactions on digital platforms. Dive into this innovative tool that revolutionizes the way we design for optimal user experience.
With different types of heatmaps at our disposal, the possibilities are endless in creating user-centric designs that resonate with your audience.
Introduction to Heatmaps for UX

Heatmaps are visual representations of data that show the intensity of user interactions on a website or app. In the context of user experience design, heatmaps are valuable tools that provide insights into how users engage with a digital product.
Types of Heatmaps for UX Analysis
There are several types of heatmaps commonly used in UX analysis:
- Click Heatmaps: Display where users click the most on a webpage, indicating areas of high interest or activity.
- Scroll Heatmaps: Show how far down a page users scroll, helping designers understand content visibility and user engagement.
- Move Heatmaps: Track mouse movement patterns, revealing areas of focus and interaction on a page.
- Attention Heatmaps: Highlight areas where users spend the most time, providing insights into content effectiveness and user behavior.
Benefits of Utilizing Heatmaps in UX Design
Using heatmaps in UX design offers numerous benefits:
- Visual Data Representation: Heatmaps provide a visual representation of user behavior, making it easy to identify trends and patterns.
- Insight into User Engagement: Heatmaps help designers understand how users interact with a website or app, enabling them to optimize the user experience.
- Identifying Problematic Areas: By pinpointing areas of low engagement or high drop-off rates, heatmaps allow for targeted improvements to enhance usability.
- Testing Design Changes: Heatmaps can be used to test the impact of design changes on user behavior, guiding iterative improvements.
Types of Heatmaps

Click heatmaps and scroll heatmaps are two common types of heatmaps used in user experience research. Click heatmaps track where users are clicking on a webpage, providing insights into the most popular areas of interaction. On the other hand, scroll heatmaps show how far down a page users are scrolling, helping designers understand user engagement and content visibility.
Move Heatmaps
Move heatmaps are used to track the movement of the mouse cursor on a webpage. This type of heatmap can reveal patterns in user behavior, such as areas of interest or confusion. By analyzing move heatmaps, designers can optimize the placement of important elements on a page and enhance user navigation.
Attention Heatmaps
Attention heatmaps indicate where users are focusing their attention on a webpage. By tracking eye movements or dwell time on specific areas, attention heatmaps provide valuable insights into user behavior and preferences. Designers can use this information to prioritize key content, improve call-to-action placement, and enhance overall user experience.
Importance of Heatmaps in UX Research
Heatmaps play a crucial role in UX research by providing valuable insights into user behavior and interaction patterns on websites and apps.
Identifying User Engagement Patterns
Heatmaps help in identifying user engagement patterns by visually representing where users are clicking, scrolling, or spending the most time on a webpage. For example, a heatmap can show which areas of a homepage are getting the most attention, allowing designers to optimize content placement for better engagement.
Optimizing Website or App Layouts, Using Heatmaps for UX
Heatmaps aid in optimizing website or app layouts by showing areas that are underutilized or overlooked by users. Designers can use this information to improve the layout, navigation, and design elements to enhance user interaction and overall user experience.
Enhancing Conversion Rates
Heatmaps assist in enhancing conversion rates on digital platforms by highlighting areas of high and low user engagement. By analyzing these patterns, designers can make data-driven decisions to optimize the conversion funnel, improve call-to-action placement, and ultimately increase the likelihood of users completing desired actions on the website or app.
Best Practices for Using Heatmaps: Using Heatmaps For UX
When it comes to utilizing heatmaps for UX design, there are several best practices to keep in mind to ensure effective implementation and accurate interpretation of data.
Guidelines for Effective Use of Heatmaps
- Choose the Right Type of Heatmap: Select the appropriate type of heatmap based on the specific research goals and the type of data you want to visualize.
- Set Clear Objectives: Define clear objectives and hypotheses before conducting heatmap analysis to guide your research and interpretation of results.
- Collect Quality Data: Ensure that the data collected for heatmap analysis is accurate, relevant, and representative of user behavior on your website or application.
- Consider Context: Take into account the context in which users interact with your design to accurately interpret heatmap data and derive meaningful insights.
Interpreting Data from Heatmaps
- Focus on Patterns: Look for patterns and trends in heatmap data to understand how users interact with different elements on your design and identify areas for improvement.
- Identify Hotspots: Pay attention to areas with the highest levels of user engagement or interaction, as these hotspots can indicate areas of interest or importance on your design.
- Compare Heatmaps: Compare different heatmaps over time or between variations of your design to track changes in user behavior and assess the impact of design changes.
Integrating Heatmap Analysis into Design Process
- Iterative Testing: Use heatmap analysis as part of an iterative design process to continuously gather feedback, make informed design decisions, and optimize user experience.
- Collaborate with Stakeholders: Involve stakeholders, designers, and researchers in heatmap analysis to ensure a comprehensive understanding of user behavior and alignment on design improvements.
- Implement Changes: Use insights from heatmap analysis to make data-driven design changes and enhancements that address user needs and preferences effectively.